
I used to have a very simple monitoring strategy for my home lab: if the fans were spinning and the LEDs were blinking, everything was fine. If the room was quiet, I had a problem.
While that approach has a certain rustic charm, it is terrible for uptime and even worse for troubleshooting. You can’t fix a performance bottleneck if you don’t have the data to prove it exists. “It feels slow” is not a metric.
Today, we are going to fix that. We are going to build a professional-grade monitoring stack from scratch. We will use Prometheus (to store data), Grafana (to visualize it), and Exporters (to collect it).
And because I like to keep my host OS clean, we are going to run the whole stack in Docker.
The Architecture: Hub and Spoke
Before we touch the terminal, let’s understand what we are building. We are designing this to be scalable from day one.
- The Hub: This is our central VM running Prometheus and Grafana.
- The Spokes: These are the agents (Node Exporters) running on every server we want to monitor.
For this tutorial, we will set up the Hub and monitor the Hub itself, plus an external Windows server to prove that this setup is hybrid-ready.
Section 1: The Environment
I am starting with a clean installation of Ubuntu Server. First, let’s get our tools installed. While there is a newer “Docker Compose V2”, on standard Ubuntu repositories, the classic Docker Compose V1 is incredibly stable and robust.
Let’s install Docker and the Compose tool:
sudo apt update
sudo apt install docker.io docker-compose
We also need to make sure our current user can run Docker commands without typing sudo every time.
sudo usermod -aG docker $USER
newgrp docker
To verify we are ready, let’s check the version:
docker-compose version
# Output: docker-compose version 1.29.2, build unknown
Section 2: Structure is Everything
If there is one thing I’ve learned after years of managing servers, it’s that “temporary” setups tend to become permanent. Dumping config files in your home folder is a nightmare waiting to happen when you need to debug this six months from now.
Let’s create a proper, dedicated workspace.
mkdir -p ~/ops/monitoring/prometheus
mkdir -p ~/ops/monitoring/grafana_data
cd ~/ops/monitoring
Section 3: The “Brain” Configuration (Prometheus)
Prometheus works on a “pull” model. It wakes up every few seconds and reaches out to specific targets to grab data. We need to tell it where to look.
Create the configuration file:
nano prometheus/prometheus.ymlPaste the following. We are defining two jobs: one to monitor the Linux Hub itself, and one for a future Windows machine.
global:
  scrape_interval: 15s

scrape_configs:
  # Job 1: Monitor Prometheus itself
  - job_name: 'prometheus'
    static_configs:
      - targets: ['localhost:9090']

  # Job 2: Monitor our Linux Host (The Hub)
  - job_name: 'node_exporter'
    static_configs:
      - targets: ['node_exporter:9100']

  # Job 3: Monitor an external Windows Server
  - job_name: 'windows-exporter'
    static_configs:
      - targets: ['192.168.1.15:9182'] # <--- Replace with your Windows IP
Note: For the Linux job, we use the hostname node_exporter. Since we are running inside Docker, Prometheus resolves the container name automatically.
Section 4: The Stack Definition
Now, let’s define our infrastructure as code. Create the docker-compose.yml file in your root folder (~/ops/monitoring).
nano docker-compose.ymlHere is the full stack definition:
version: '3.8'

services:
  prometheus:
    image: prom/prometheus:latest
    container_name: prometheus
    volumes:
      - ./prometheus/prometheus.yml:/etc/prometheus/prometheus.yml
    ports:
      - "9090:9090"
    command:
      - '--config.file=/etc/prometheus/prometheus.yml'
    networks:
      - monitoring_net

  node_exporter:
    image: prom/node-exporter:latest
    container_name: node_exporter
    # We mount the HOST paths so the container can see the VM's metrics
    volumes:
      - /proc:/host/proc:ro
      - /sys:/host/sys:ro
      - /:/rootfs:ro
    command:
      - '--path.procfs=/host/proc'
      - '--path.sysfs=/host/sys'
      - '--collector.filesystem.mount-points-exclude=^/(sys|proc|dev|host|etc)($$|/)'
    networks:
      - monitoring_net

  grafana:
    image: grafana/grafana:latest
    container_name: grafana
    ports:
      - "3000:3000"
    volumes:
      - ./grafana_data:/var/lib/grafana
    environment:
      - GF_SECURITY_ADMIN_PASSWORD=admin
    networks:
      - monitoring_net

networks:
  monitoring_net:
    driver: bridge
Section 5: The “Oops” Moment (Troubleshooting)
Time to fire it up.
docker-compose up -dWhen I first ran this, I checked the status (docker-compose ps) and saw that Grafana had crashed with an Exit 1 status.
docker-compose ps
# grafana    /run.sh     Exit 1
When a container dies instantly, it’s usually trying to tell us something. I checked the logs:
docker-compose logs grafanaThe error was clear: GF_PATHS_DATA='/var/lib/grafana' is not writable. The Grafana container runs as user ID 472, but the folder I created was owned by my user. It didn’t have permission to write.
The Fix: We need to change the ownership of that folder to match the ID that Grafana expects.
sudo chown -R 472:472 grafana_data
docker-compose restart grafana
Now, docker-compose ps shows everything as Up.
Section 6: Adding the Windows Agent
We added a Windows IP to our config in Section 3, but we need to actually set up the agent on that machine.
- Log into your Windows Server.
- Download the
windows_exporterfrom prometheus-community/windows_exporter releases page. - Run it. It installs as a service and opens port 9182. (Check your Windows Firewall if connections fail).
- To verify it’s working, open a browser on that Windows machine and go to
http://localhost:9182/metrics. If you see a wall of text describing your system, the agent is live.
Now Prometheus is collecting data from both Linux and Windows. But we can’t see it yet.
Section 7: Visualization (The Payoff)
This is where it all comes together. Open your browser and go to http://<YOUR-HUB-IP>:3000. Log in with admin / admin.
1. Connect the Data Source Go to Connections -> Add new connection -> Prometheus.
In the URL field, type: http://prometheus:9090
Do not use localhost. Grafana needs to talk to the Prometheus container name. Click Save & Test.
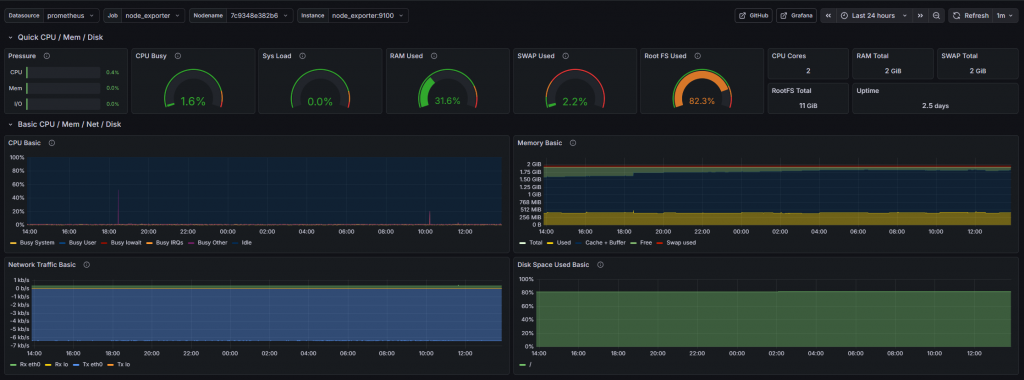
2. Import the Linux Dashboard We don’t need to build graphs manually.
- Go to Dashboards -> New -> Import.
- Enter ID 1860 (Node Exporter Full).
- Click Load, select your Prometheus source, and Import.
- Result: You now have a full view of your Linux Hub’s performance.
3. Import the Windows Dashboard If you look for your Windows server in the previous dashboard, you won’t find it. Windows uses different metric names.
- Go to Import again.
- Enter ID 23942 (Windows Exporter Dashboard).
- Click Load, select your Prometheus source and Import.

Conclusion
You have successfully gone from a blank terminal to a fully monitored hybrid infrastructure. You have a central Hub collecting data, and you have professional dashboards for both Linux and Windows.
This setup is the foundation. From here, you can add alerts to Slack when disk space runs low, or add exporters for your Docker containers, databases, and websites. But for now, take a moment to enjoy the graphs. It beats staring at htop.