

Welcome back! In the previous post, we laid the foundation by performing a baseline UDP performance test between two ESXi hosts using iPerf. That gave us a solid starting point to understand what “normal” looks like.
Now it’s time to dive deeper.
In this part, we’ll simulate more complex and stressful conditions—starting with CPU overload—to see how it impacts packet loss and jitter. We’ll also put the powerful pktcap-uw tool to good use, capturing traffic at different layers of the network stack to get a clearer picture of where things might go wrong.
Whether you’re dealing with UDP-heavy workloads, troubleshooting VoIP issues, or just curious about network behavior in virtualized environments, this part is where things really start to get interesting.
Identify Active vmnics on Sending and Receiving ESXi Hosts
Since we’re using IP hash-based load balancing, one challenge is identifying which vmnic is actually being used to send traffic. We’ll generate traffic with iPerf3 and use esxtop to monitor traffic levels per NIC and determine the active path, then start pktcap-uw on that vmnic to capture packets at the physical layer.
Step one: Generate Traffic to Identify vmnics on Both Hosts with esxtop
We start by generating high traffic between the two VMs using iPerf3. One VM acts as the server, the other as the client — and for this task, it’s preferable to use TCP traffic, as it’s easier to spot in monitoring tools like esxtop.
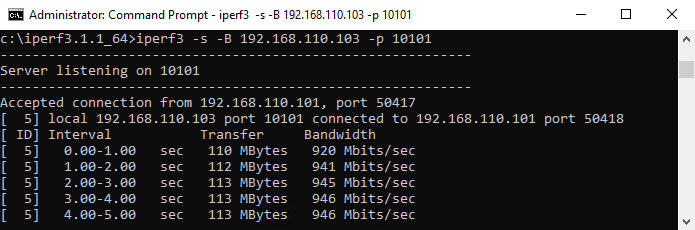
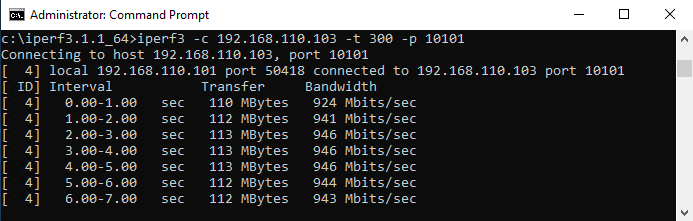
At this stage, we’re not analyzing performance or packet quality; the only goal is to identify which physical NIC (vmnic) is used on both the sending and receiving ESXi hosts.
To do that, we connect to each host via SSH, launch esxtop, and press n to enter the network view. While the traffic is running, we observe which vmnic shows increased throughput — that’s the one carrying the traffic.
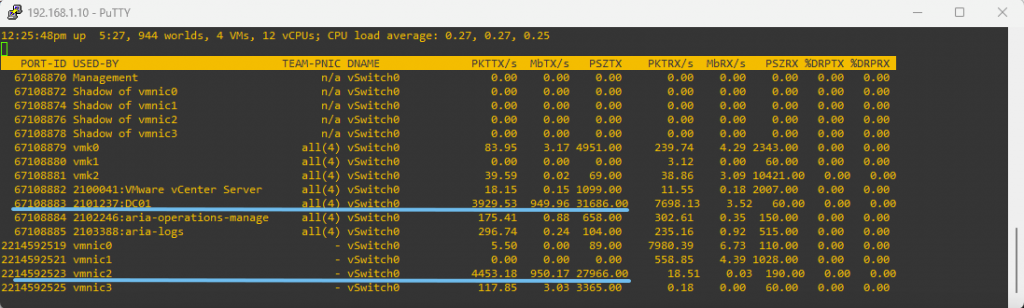
IP Host 192.168.1.10 – Sending Host using vmnic2
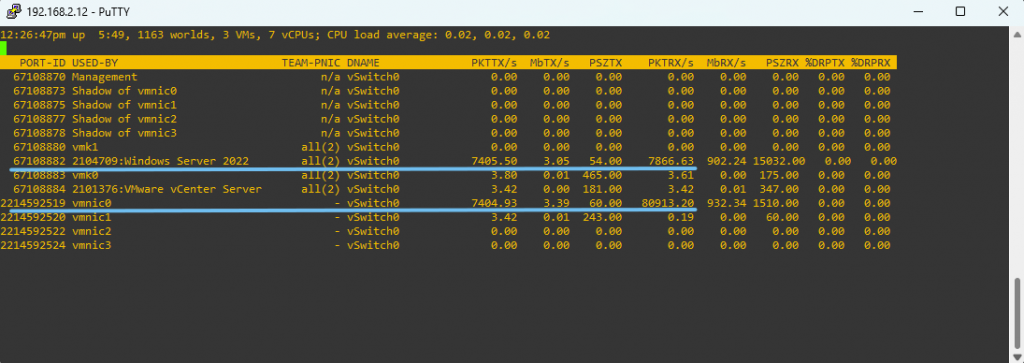
IP Host 192.168.2.12 – Receiving Hosts using vmnic0
Using the above commands, we can also identify the switch ports assigned to each VM. In our case, the sending VM (DC01) is connected to port 67108883, while the receiving VM (Windows Server 2022) is connected to port 67108882. As you can see, the ESXi hosts are managed by different vCenter instances.
Another useful command to display the VMs and their respective switch and switchports is:
net-stats -l 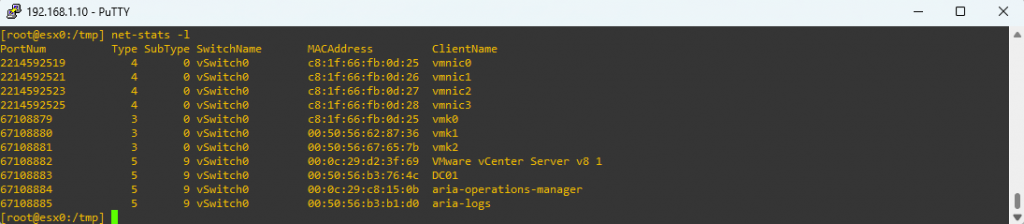
Step two: What If You Can’t Identify the vmnic Easily?
In environments with multiple VMs and active connections, pinpointing the correct vmnic can be tricky. Traffic might be spread across interfaces due to load balancing, or the load may be too light to stand out in esxtop.
If you’re unable to clearly identify the active NICs for either host, you can take a different approach: run pktcap-uw on all physical NICs one by one and look for packets matching your test traffic.
pktcap-uw allows capturing packets inside the ESXi network stack, at different points like the virtual switchport or the physical uplink.
You can list all physical uplinks with:
esxcli network nic list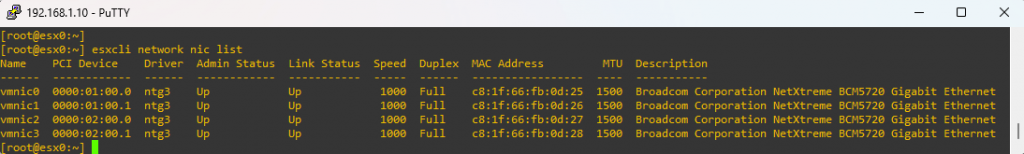
Then, start a capture on each vmnic until you spot the iPerf traffic:
pktcap-uw –uplink vmnicX –proto 0x06 -p 40000 -o trace_vmnicX.pcap
On the sending host, we issued the command below and, just like before, confirmed that the traffic flows through vmnic2.:
#pktcap-uw --uplink vmnicX --dstip 192.168.110.103 --proto 0x06 -p 10101 --dir 1 -o trace_vmnicX.pcap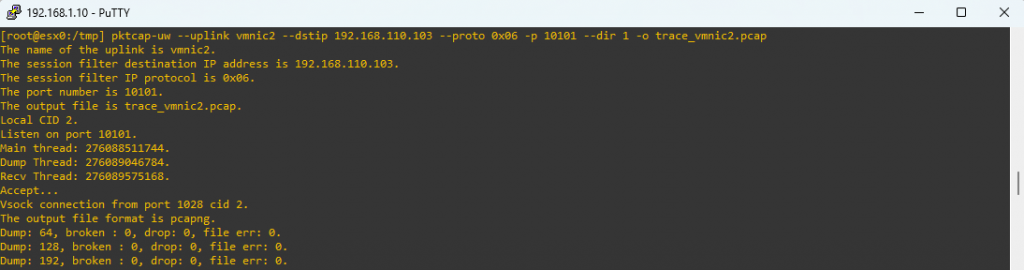
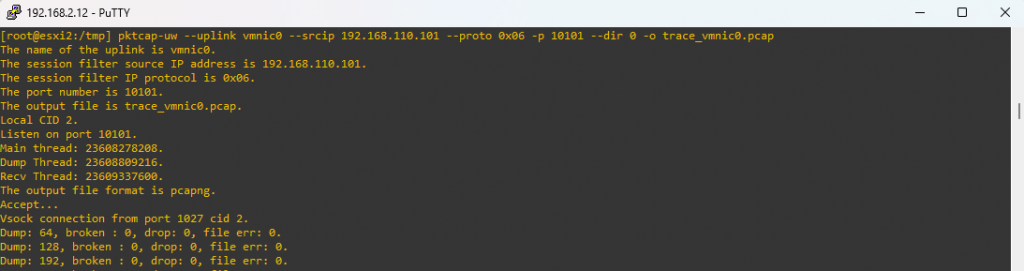
On the receiving host, we issued the command below:
pktcap-uw --uplink vmnic0 --srcip 192.168.110.101 --proto 0x06 -p 10101 --dir 0 -o trace_vmnic0.pcap
Scenario 2: UDP Performance Test on Windows VMs
Goal: In this test, the goal was to evaluate how different CPU load conditions inside the virtual machines impact UDP packet transmission and reception.
To achieve this, we prepared and tested three distinct sub-scenarios:
- No CPU Load
- Both the sending and receiving VMs operated under normal CPU utilization, with no artificial load introduced.
- High CPU Load on the Sending VM
- The sending VM was stressed using Microsoft’s CpuStres tool to simulate a heavy CPU load condition, while the receiving VM remained idle.
- High CPU Load on the Receiving VM
- The receiving VM was stressed with high CPU utilization, while the sending VM remained idle.
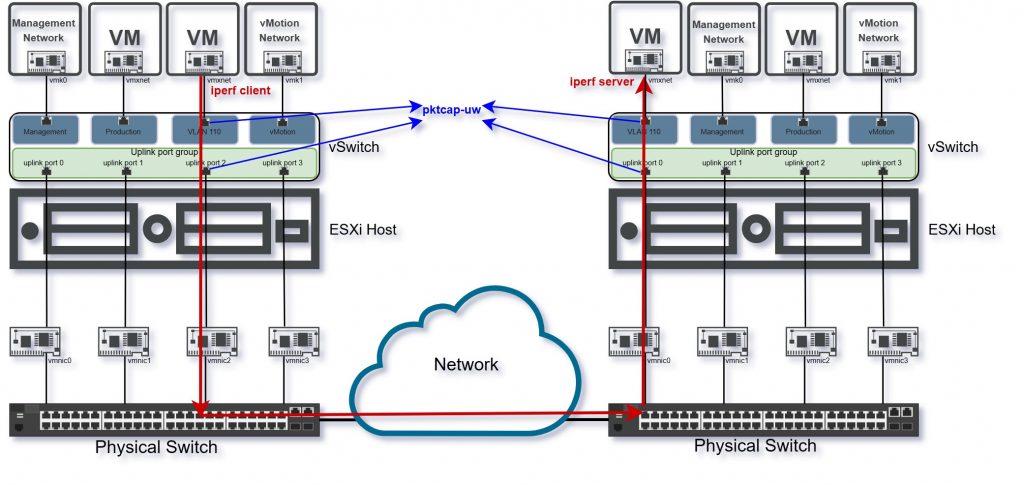
Method: For each scenario, we generated UDP traffic between the two Windows Server VMs using iPerf3 and simultaneously captured the network traffic at multiple layers:
- The virtual switchport of each VM
- The physical uplink NICs on both ESXi hosts
- The physical switch connecting the hosts
All packet captures will be saved and later analyzed in Wireshark to identify any inconsistencies.
Let’s see now the steps for generating and capturing the traffic.
Step one: Start iPerf3 on Windows VMs
Start iPerf3 server and client on Windows VMs to generate UDP traffic:
iperf3 -s -B 192.168.110.103 -p 10101 --> Server
iperf3 -c 192.168.110.103 -u -b 5M -l 1400 -t 100 -p 10101 --> Client
Step Two: Start pktcap-uw packet capture
Connect to sending host via SSH, find a location on the datastore to save the pcap files and then start the trace on both switchport and vmnic.
It’s not recommended to save files in the /tmp directory. Ideally, you should identify a VMFS datastore and save your files there instead.
pktcap-uw --switchport 67108883 --capture VnicTx --dstip 192.168.110.103 --proto 0x11 -o /vmfs/volumes/Datastore/traces/esxi0.switchport.67108883.pcapng & pktcap-uw --uplink vmnic2 --capture UplinkSndKernel --dstip 192.168.110.103 --proto 0x11 -p 10101 -o /vmfs/volumes/Datastore/traces/esxi0.uplink.vmnic2.pcapng &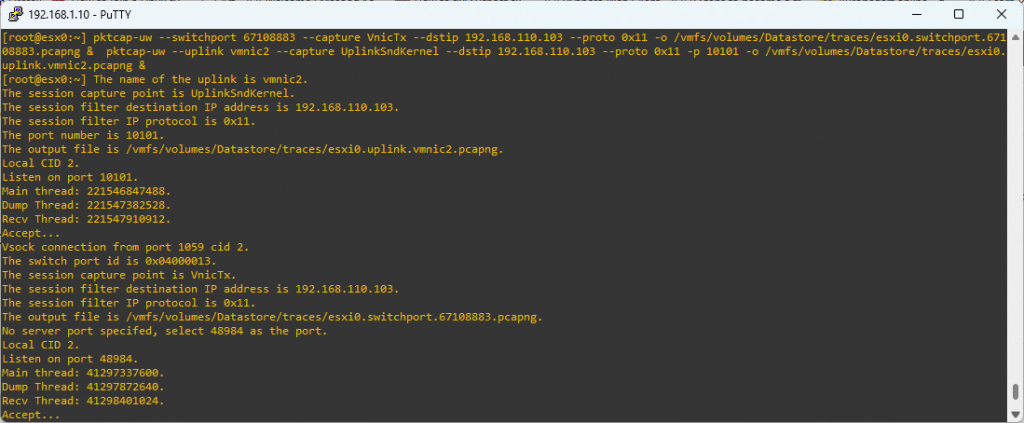
Connect to the receiving host via SSH, choose a location on a datastore to save the pcap files, and then start packet capture on both the switch port and the vmnic.
pktcap-uw --switchport 67108882 --capture VnicRx --srcip 192.168.110.101 --proto 0x11 -o /vmfs/volumes/DatastoreESXi2/traces/esxi2.switchport.67108882.pcapng & pktcap-uw --uplink vmnic0 --srcip 192.168.110.101 --proto 0x11 -p 10101 -o /vmfs/volumes/DatastoreESXi2/traces/esxi2.uplink.vmnic0.pcapng &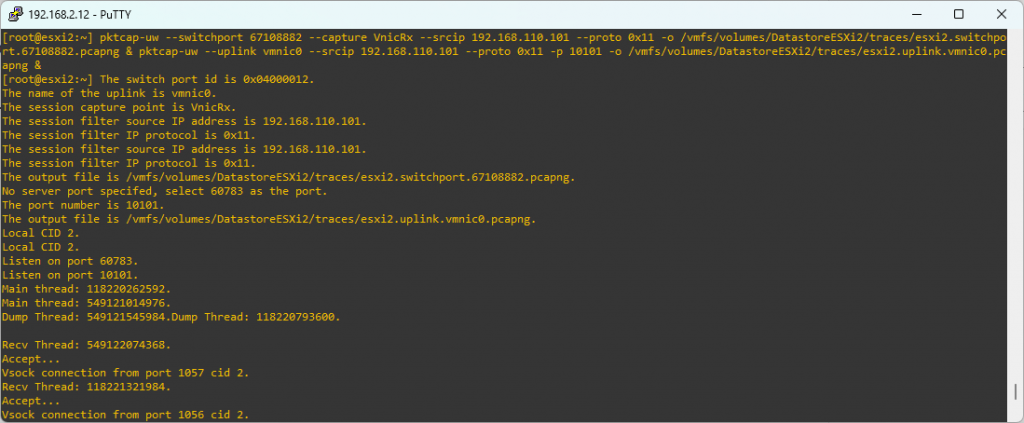
To stop pktcap-uw tracing use the kill command:
kill $(lsof | grep pktcap-uw | awk '{print $1}' | sort -u) To be sure that all pktcap-uw traces are stopped, run this command:
lsof | grep pktcap-uw | awk '{print $1}' | sort -u
Now that we’ve gathered all the traces from our three scenarios and safely stored the evidence, maybe it’s a good moment to catch our breath.
After all, analyzing hundreds of thousands of packets deserves a fresh coffee — and perhaps a bit of suspense.
What’s Next
In the next part of this series, we will analyze the captured packet traces in detail using Wireshark, and compare the results across the three CPU load scenarios. We will pinpoint exactly where packet loss occurs and how CPU stress inside VMs affects UDP traffic quality. Stay tuned!