
“ESXi Packet Loss Troubleshooting with iPerf3 and pktcap-uw”
- Part 1: Baseline Testing and Setup
- Part 2: Capturing UDP Traffic Under Different CPU Loads
- Part 3: Analyzing Packet Loss with Wireshark ← You are here
- Part 4: UDP Loss from Link Flapping and Network Instability
- Part 5: Inter-VLAN UDP Loss Caused by Bandwidth Limits
Let’s continue our deep dive into how CPU load affects UDP traffic in ESXi.
Now that we’ve gathered all our packet captures from the three different CPU load scenarios, it’s time to dive into the analysis.
In this part, we’ll open up the traces in Wireshark, take a closer look at how the packets behaved, and find out exactly where — and why — packet loss occurred.
By the end of this post, we’ll see clear evidence of how VM CPU load impacts UDP traffic, and why sometimes the network isn’t to blame when packets go missing.
Let’s walk through each scenario.
Scenario 2/1: No CPU Load (Baseline)
With no artificial CPU load on either the sending or receiving VM, the UDP traffic flowed smoothly across the network.
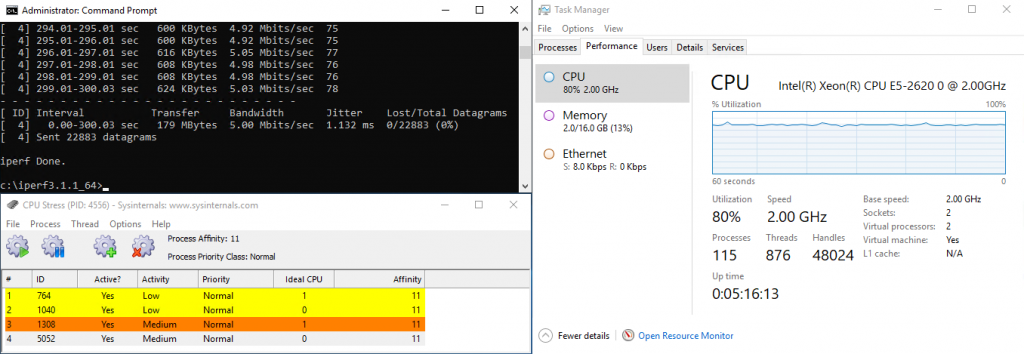
Findings:
- Packet captures showed consistent packet arrival with no significant delays.
- The “Delta Time Displayed” values in Wireshark were stable and small, indicating steady packet transmission.
- Packet counts matched closely at all capture points — switchports, uplinks, and even at the physical switch.
- iPerf3 reported zero packet loss during the test.
Conclusion: Under normal CPU conditions, the network and the ESXi hosts handled UDP traffic reliably. This provided us with a clean baseline for comparison with the stress scenarios.
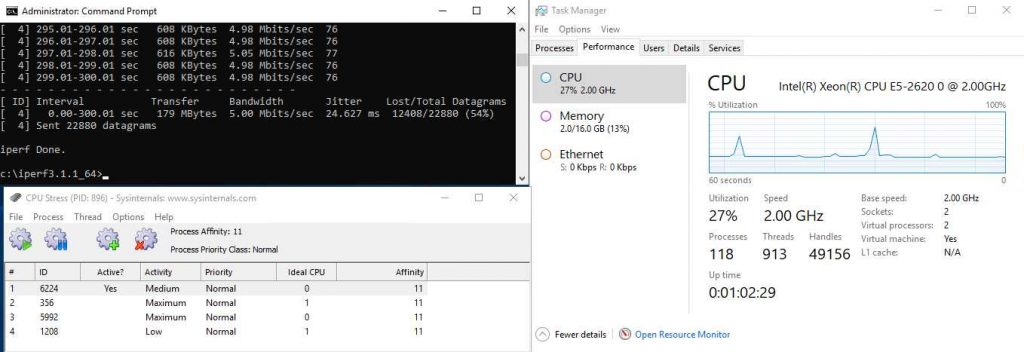
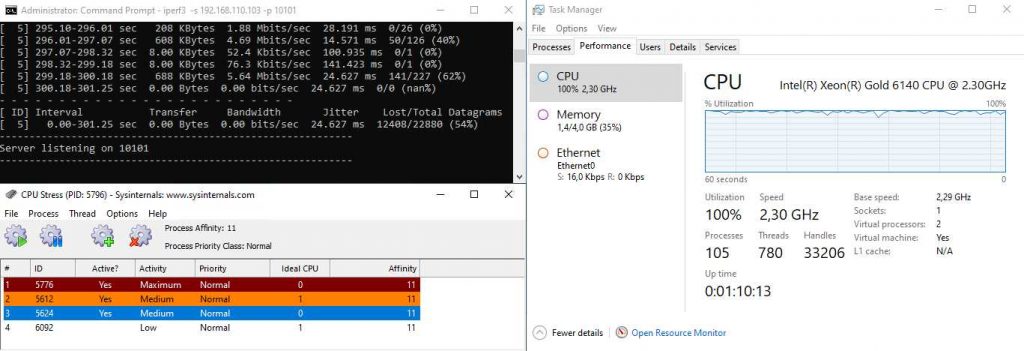
Scenario 2/2: High CPU Load on Sending VM
When CPU stress was applied to the sending VM, the behavior changed significantly.
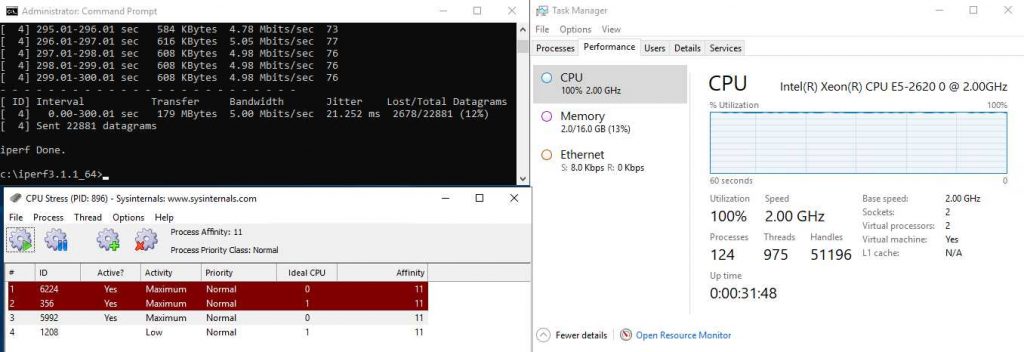
Findings:
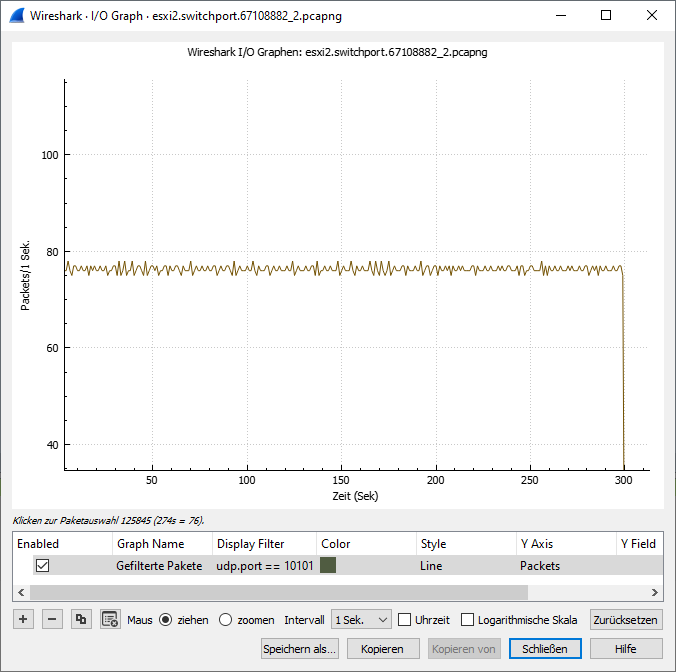
- Packet captures at the sending side (switchport and uplink) showed irregular packet bursts instead of a smooth flow.
- Wireshark “Delta Time Displayed” analysis revealed multiple gaps, indicating micro-pauses between packet transmissions.
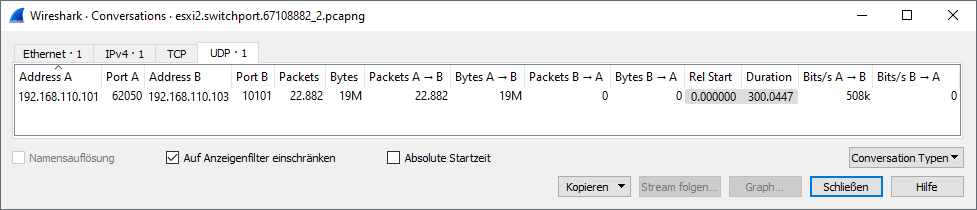
- Packet counts on the sender side were lower than expected even before packets left the ESXi host.
- Packet counts at the physical switch were already lower than expected, indicating that loss occurred before the traffic even left the ESXi host.
- iPerf3 reported significant packet loss.
Conclusion: The heavy CPU load on the sending VM delayed the generation of UDP packets, causing irregular transmission bursts.
This led to packet drops before the network even had a chance to deliver them — confirming that packet loss started at the sender under CPU stress.
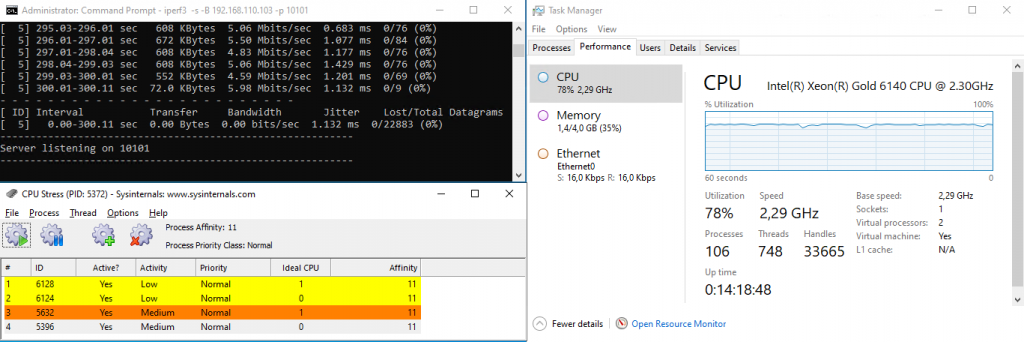
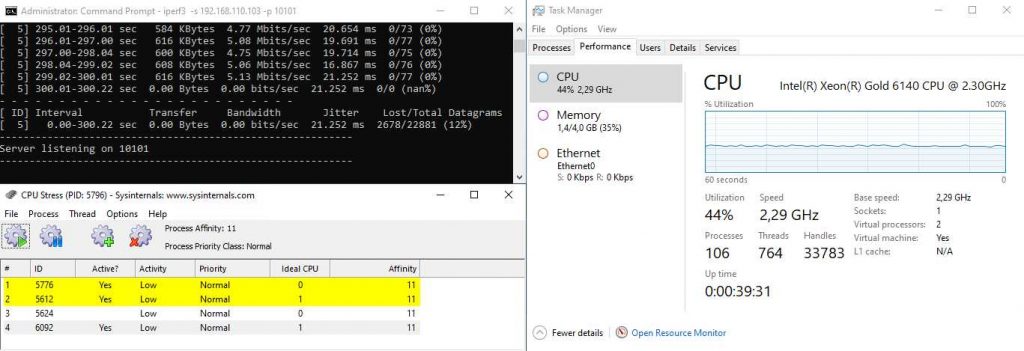
Scenario 2/3: High CPU Load on Receiving VM
When stress was applied to the receiving VM, the network showed a different story.
Findings:
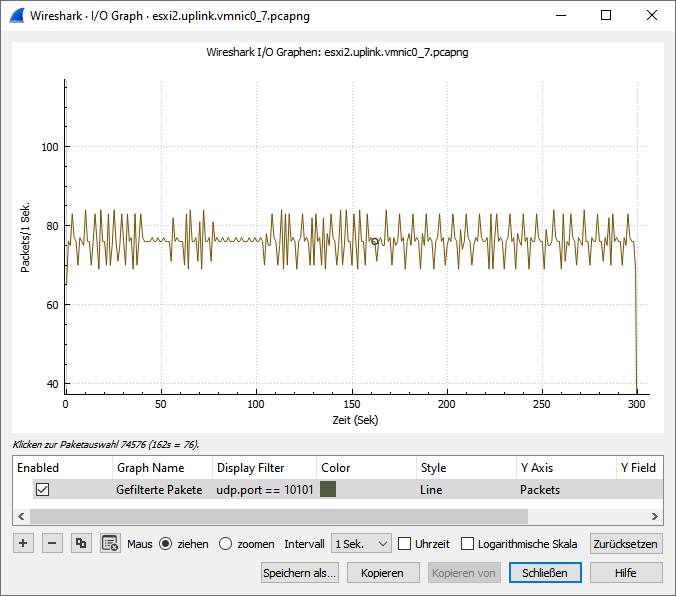
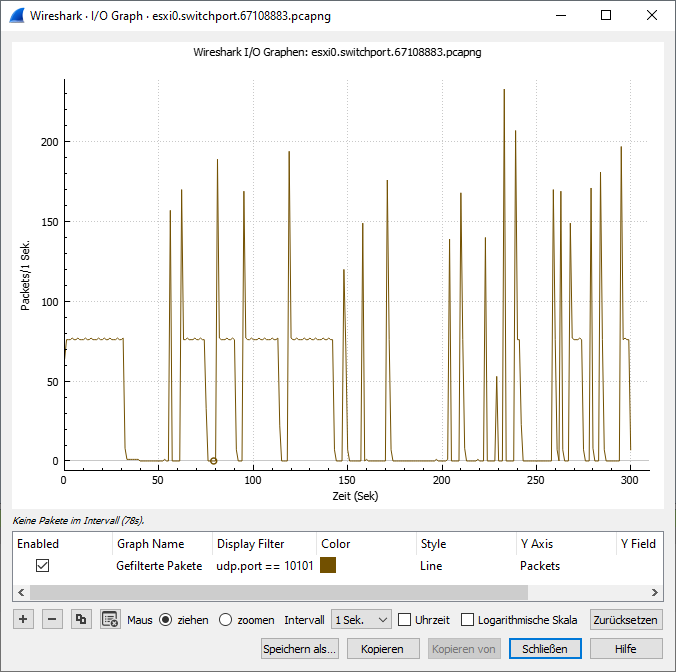
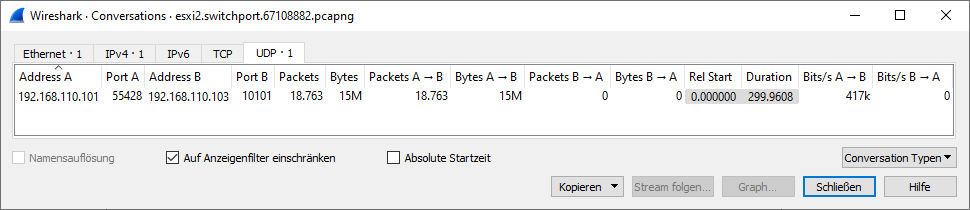
- Packet captures across the network path — from the sender’s uplink to the receiver’s switchport — showed consistent packet delivery.
- Packet counts matched almost perfectly up to the receiving VM’s switchport.
- No significant packet loss was observed on the network side.
- However, iPerf3 still reported lost packets.
Conclusion: All packets were successfully delivered to the ESXi receiving host, but the heavily stressed receiving VM was unable to process them in time.
This confirms that packet loss occurred inside the guest OS, after the packets reached the VM’s virtual network interface.
| Scenario | Packets Captured | iPerf Loss? | Root Cause |
|---|---|---|---|
| No CPU Load | All expected packets received | ❌ No | Normal behavior |
| High CPU Load on Sender | Fewer packets seen at switchport | ✅ Yes | VM delayed transmission |
| High CPU Load on Receiver | All packets received at switchport | ✅ Yes | Packets dropped inside guest OS |
Final Thoughts
Through these three test scenarios, we’ve seen how UDP packet loss in ESXi environments can stem from CPU limitations inside the virtual machines, not necessarily from the network itself. Whether it’s a sender under pressure struggling to transmit, or a receiver too busy to process arriving packets, internal VM load can significantly impact traffic behavior.
By combining iperf3, pktcap-uw, and Wireshark, we’ve shown how to trace packet flow end-to-end — and more importantly, how to pinpoint where packets are actually lost.
This approach not only improves visibility, but also avoids misdiagnosing problems as “network issues” when the root cause lies deeper. For any engineer working with VoIP, UDP streaming, or real-time workloads, this kind of packet-level validation is invaluable.
What’s Next
While stressing the CPU revealed how much packet loss can originate inside the VM itself, our next scenario flips the focus entirely — what happens when the network connection itself becomes unstable? In Part 4, we’ll simulate brief link failures to see just how fragile UDP traffic can be when the transport layer gets disrupted. Get ready for some packet chaos!